
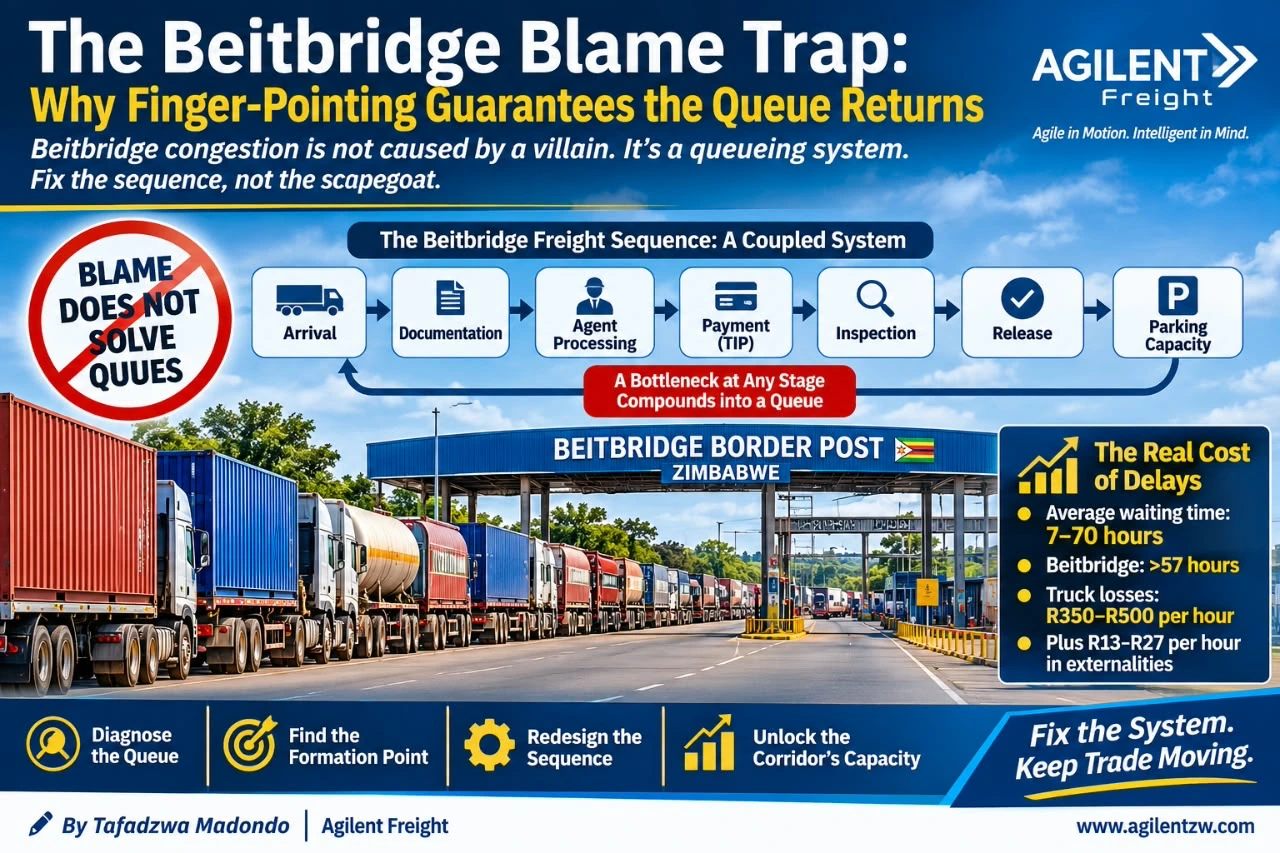
The central idea
Blame can explain an incident, but it does not redesign the sequence that produced the queue. Measure the hand-offs, locate the first sustained imbalance and change the control at that point.
For Zimbabwean freight operators, corridor managers and regional supply-chain decision-makers.
The ritual is familiar. A queue forms at Beitbridge. Trucks stack up on the approach roads. Drivers lose hours, delivery commitments start slipping, and operators begin calculating the cost of immobile equipment. Then comes the second queue: statements explaining why the problem belongs somewhere else.
South Africa’s Border Management Authority (BMA) has publicly attributed delays to constraints on the Zimbabwean side, including limited parking capacity, abnormal-load vehicles occupying bays and slower clearing-agent throughput. Zimbabwean-side constraints, in turn, sit within a wider sequence of processing, release and receiving capacity. In December 2025, BMA Northern Region Commander Ntakuseni Lambani described the mechanism plainly: when Zimbabwe cannot receive more trucks because parking is full, movement is stopped; trucks then accumulate on South Africa’s N1. [1]
The exchange itself is evidence: each participant describes a local constraint, while the system converts those constraints into a corridor-wide queue. The queue drains, attention moves elsewhere, and the architecture remains unchanged.
This is the Beitbridge blame trap: blame acts as a pressure-release valve. It offers a satisfying explanation and gives institutions a defensible position, but it does not redesign the sequence that generated the delay. Retrospective fault-finding asks, “Who caused this?” Operational diagnosis asks, “At which point did the system lose the ability to absorb variation—and what change would prevent the queue from forming again?”
For Zimbabwe freight operators and corridor managers, the second question is worth money. The first usually produces another statement.
Why Beitbridge congestion is a queueing-system problem
A queue is not proof that one organisation has failed. It is what happens when arrivals reach a service system faster than that system can process them, or when the service rate becomes too variable for the system’s available buffer. If trucks arrive at a steady rate but one stage slows, work accumulates before that stage. If the stages are tightly coupled, the backlog soon affects other stages too.
A freight border is a chain of dependent service points. A truck moves to the next stage only when the previous task is complete and the next stage has room. Customs release does not create road space, and a fast terminal cannot push traffic into a full receiving yard.
Parking capacity illustrates the coupling. If the Zimbabwean side has no space to receive another truck, it must throttle or stop the flow entering its system. The South African side may still have officers, lanes and software ready to process vehicles, but its output has nowhere to go. The upstream stage is forced to reduce its service rate because the downstream stage has reached its physical limit. The queue then grows on the N1, even if the immediate obstruction is not located there.
Tight coupling makes small disturbances dangerous. A late document, abnormal load, payment exception or slow inspection may be manageable alone. With little spare capacity, no buffer and no arrival control, however, the disturbance consumes available slack. Once the buffer is exhausted, a short interruption can produce a much longer queue.
The Beitbridge border queue system: follow the dependency arrows
The useful unit of analysis is not “the border” in the abstract. It is the actual freight sequence and the conditions required for each hand-off.
Truck arrival → pre-arrival readiness and document validation → clearing-agent processing → duties, fees and other payments → inspection or examination where required → customs and border release → safe receiving space and onward movement.
The arrows matter. If documentation is incomplete, agent processing cannot finish cleanly. If agent processing is delayed, payment and inspection may be delayed too. If payment is the required gate before release, a payment failure blocks every truck behind it. If a truck is released but the receiving area or exit flow is saturated, release does not translate into movement. The vehicle has changed administrative status but has not left the system.
Arrival variability is the first pressure point: waves of vehicles can create a queue before a counter becomes inefficient. Pre-arrival readiness matters too, because documentation errors discovered at the border consume scarce service time.
Clearing-agent throughput is a node in the sequence, not a ready-made scapegoat. The BMA has cited slower agent processing as one contributor to backlog. The analytical question is why agent throughput varies and why the system allows that variation to become a corridor-level blockage. Are files arriving incomplete? Are data formats inconsistent? Are declarations submitted too late? Are exceptions being discovered only after the vehicle is physically in the queue? Are agents processing work in arrival order when some files could be validated before arrival? Those are testable mechanisms, unlike a general claim that agents are slow.
Payment is another gate. Reports from December 2025 described motorists waiting as long as nine hours for temporary import permits (TIPs), with online application not removing the need for a physical payment step at the border. [2] This example concerns light vehicles rather than commercial freight, but the systems lesson is directly relevant: digitising one step does not digitise the transaction. If application is online but payment remains a physical bottleneck, the queue simply relocates to the remaining manual node. The single point of failure holds up everything dependent on it.
Inspection and release also vary because not every consignment requires the same treatment. Routine flows need a path that is not blocked by exceptions. Finally, parking and exit capacity determine whether processed vehicles can actually move.
The queue can form at any node, while its visible location may be upstream of the true constraint. A line of trucks on the N1 is an observation, not a diagnosis. The formation point is where incoming work persistently exceeds effective capacity and consumes the available buffer—at a payment counter, documentation exception, receiving yard, inspection resource or cross-border intake mismatch.
The cost of Beitbridge delays: time becomes a balance-sheet problem
The commercial cost is too large to treat congestion as an inconvenience or a seasonal public-relations issue. A 2026 Southern African Transport Conference paper applying queueing theory to four major border posts reported average waiting times ranging from seven to 70 hours, with extreme Beitbridge delays exceeding 57 hours. Across the four crossings, heavy goods vehicles were estimated to lose approximately 68,000 hours each week. The paper put direct truck delay costs at R350–R500 per truck per hour, with additional externality costs of R13–R27 per hour. [3]
These figures are not a Beitbridge-only weekly total; they describe the four-border-post sample. Their value is to show the scale of the economics. At R350–R500 per truck-hour, a 20-hour delay implies R7,000–R10,000 in direct time-related cost before any cargo-specific consequences are added. Refrigerated cargo may incur additional power and temperature-management exposure. A delayed tautliner may miss its next loading slot. A driver and vehicle that are waiting cannot earn revenue elsewhere. Finance costs continue, delivery windows are missed, and inventory remains tied up.
The cited study also estimates 20-hour delay costs of R25,165 for a tautliner and R22,897 for a refrigerated truck under its cost assumptions. [3] Those are modelled figures, not universal tariffs; each operator should substitute its own fleet, driver, fuel, finance and cargo-risk costs. But the decision principle is robust: delay has an hourly price, and the price accumulates while the argument about fault continues.
Blame does not reduce the truck-hour bill. Sequence intervention can.
Beitbridge modernisation and congestion: why the queue returns
The modernisation paradox is instructive. Beitbridge has undergone an upgrade reported at approximately US$300 million. The Herald reported in August 2025 that 46% of commercial traffic was being cleared within three hours, compared with previous clearance periods of up to 72 hours. Other reports on the modernised facility have also described substantially shorter clearance times for a significant share of commercial cargo. [4]
Those improvements matter. They are evidence that infrastructure, traffic separation, automation and process tracking can increase throughput. They are not proof that every journey is consistently fast, or that all constraints across both sides of the border have disappeared. A percentage cleared within three hours can coexist with a long tail of difficult cases and with queues caused by surges, receiving limits or a bottleneck outside the improved process.
Improving one node is not the same as redesigning the system. Faster processing pushes more trucks toward the next stage; if parking, inspection, payment, exit or cross-border intake capacity does not keep pace, the bottleneck migrates.
Recurring congestion does not mean modernisation failed. It shows that hardware and local process improvements are insufficient without operating rules, buffers and cross-border release controls matched to capacity. If agencies are measured only on local speed, they can maximise output that overwhelms the next stage. The objective must be stable end-to-end flow, not isolated node efficiency.
How to fix Beitbridge border delays: a formation-point diagnostic
A practical diagnostic must find the point where the queue begins to form, not the place where it becomes visible or the organisation most convenient to blame. Corridor managers, border agencies and freight operators can apply the following method to a specific traffic stream, shift or commodity group.
- Define the flow and the unit of measurement. Choose a cohort that can be compared: for example, commercial trucks moving northbound during a defined shift, or refrigerated consignments using a particular clearance path. Record arrival time, completion time at each stage, departure time and any stop reason. Do not blend passenger traffic, commercial freight and exceptional cargo into one average if they follow different processes.
- Map the real sequence, including hand-offs. Draw every mandatory step and the condition for moving to the next. Mark physical constraints (lanes, bays, parking, inspection areas), transactional constraints (payments, declarations, permits) and decision constraints (risk selection, document queries, release authorisation). For each arrow, identify who owns the hand-off and what information or capacity must be available. A process map that omits the hand-offs will miss the coupling.
- Measure queue length and waiting time at each stage. Capture arrival rate, service rate, queue length, waiting time and the percentage of cases that need rework. Measure at regular intervals, not only after a crisis. A stage that processes quickly on average may still be unstable if its service time is highly variable. Track the median and upper percentiles, not just the average; a long tail can immobilise equipment and break delivery plans.
- Locate the first sustained imbalance. Compare the rate work arrives at each stage with the rate it can complete work. The formation point is usually the first stage where arrivals persistently exceed effective service capacity and the available buffer starts filling. Then trace the impact upstream and downstream. If the visible queue is on the N1 but the receiving yard is full, the formation point is the receiving-capacity constraint. If the queue is at a payment gate despite online applications, the unresolved physical payment step may be the controlling node.
- Separate demand surges from capacity loss. A queue may arise because arrivals increased, because service capacity fell, or because the mix of cases became more complex. These require different responses. Arrival surges may need appointment windows, pre-arrival staging or metering. Lost capacity may need a changed process, contingency lane or revised operating rule. Complex cases may need an exception path so they do not consume routine-flow capacity. Do not prescribe extra staff until measurement establishes that labour is the binding constraint.
- Test a targeted intervention against a baseline. Change one structural variable at a time where feasible: pre-validate documents before dispatch; move an eligible payment step out of the physical queue; separate abnormal loads from standard truck parking; meter upstream release to available receiving capacity; or route exceptions into a dedicated workflow. Compare waiting-time percentiles, queue length, rework rate and end-to-end clearance before and after. A successful intervention should reduce the queue at its formation point without simply moving the backlog to another node.
- Establish a cross-border flow rule. One side should not release vehicles into a downstream system that cannot receive them. Set a shared operating trigger based on receiving-space occupancy and downstream processing capacity. When the threshold is reached, upstream release or arrival metering should adjust automatically according to an agreed rule. This is not a request for goodwill; it is a control mechanism for a coupled system. The rule needs a named owner, a measurable trigger, a response and an escalation path.
- Assign accountability to the intervention, not just the incident. For each recurring queue, record the measured formation point, the change made, the person or unit empowered to make it, and the result after a defined period. An incident report that names an agency but does not specify a change to capacity, sequencing or control logic is incomplete. The test of learning is whether the next comparable surge produces a smaller queue.
The SADC trade corridor needs sequence design, not another blame cycle
Beitbridge is a strategic hinge between Zimbabwe, South Africa and the wider SADC trade corridor. Its performance affects the North–South Corridor, the Beitbridge–Bulawayo corridor, inventory cycles in Harare and the reliability of cross-border freight Zimbabwe depends on. The commercial system does not care which side issued the most persuasive statement. It experiences the total time from arrival to onward movement.
That is the central reframe. BMA, ZIMRA, clearing agents, parking operators, inspection functions and transporters each control part of the process. None can guarantee end-to-end performance by optimising its own node alone. A system with sequential dependencies must be governed through its hand-offs, buffers and release rules. Otherwise, every local improvement risks sending more work into the next constraint.
The queue will return whenever the system allows a stage to discharge work without regard to downstream capacity, discovers avoidable exceptions only after arrival, or treats payment and documentation as separate from physical throughput. It will also return when performance reporting rewards local speed while ignoring total corridor time.
The alternative is not a new villain, a general appeal to collaborate, or an automatic call for more staff. It is a discipline: measure the sequence; locate the first sustained imbalance; change the control at that point; and verify that the queue has shrunk rather than migrated.
For the operator, this discipline protects equipment utilisation, delivery reliability and working capital. For the corridor manager, it turns recurring congestion from a public argument into a testable operating problem. For the region, it makes border-post efficiency a property of the whole trade route rather than a claim made by any single institution.
The commercially useful question at Beitbridge is therefore not who caused the queue last time. It is where the next queue will form—and what rule, buffer or hand-off can be changed before it does.
Sources and scope
The figures cited here reflect specific reports and dates, not guaranteed or current clearance times. Waiting-time and hourly-cost estimates in the 2026 Southern African Transport Conference paper cover four border posts; they are not Beitbridge-only weekly totals. TIP queue reports concern light vehicles and are used only to illustrate a bottleneck in a digitised process. The border-modernisation statistics are figures reported by the cited news source.
- SABC News — High traffic at Beitbridge as BMA processes surge of travelers (16 December 2025): https://www.sabcnews.com/sabcnews/high-traffic-at-beitbridge-as-bma-processes-surge-of-travelers/
- ZimLive — Drivers face travel delays at Beitbridge in peak Christmas traffic (December 2025): https://www.zimlive.com/drivers-face-travel-delays-at-beitbridge-in-peak-christmas-traffic/
- Meyer and Van Rensburg — Quantifying the Financial and Economic Cost of Cross-Border Land Post-Queuing: A South African Road Freight Corridor Perspective (SATC 2026): https://www.researchgate.net/publication/408720512_QUANTIFYING_THE_FINANCIAL_AND_ECONOMIC_COST_OF_CROSS-BORDER_LAND_POST-QUEUING_A_SOUTH_AFRICAN_ROAD_FREIGHT_CORRIDOR_PERSPECTIVE
- The Herald — Beitbridge Border Post sets regional benchmark with US$300 million upgrade (7 August 2025): https://www.heraldonline.co.zw/beitbridge-border-post-sets-regional-benchmark-with-us300-million-upgrade/